

Weekly Stock Bullfinder- Week of 11/22
Weekly Stock Bullfinder- Week of 11/22
Stocks I'm Watching - Week of 11/22

Hope everyone had a nice weekend!
Charts of the Year?
I saw these two charts posted on Twitter that I thought were incredibly interesting to put into context our current supply and demand issues here in the US. The Federal Reserve chart shows PCE levels of durable goods and services over a 30 year period. The chart shows a 25-year deflationary trend for consumer durables pre-pandemic, that now it is seeing a parabolic overshoot compared to its long term downward trend. The second chart illustrates that while there is certainly supply chain issues, the overstimulation of the demand side by fiscal stimulus has just not allowed the supply side to catch up. There are a number of factors in play here including companies using just-in-time inventory ordering now leading to panic buying, port COVID-19 issues, supply chain offshoring, warehousing and truck driver retirements, price gouging, among others. It is all these reasons in my opinion that the Federal Reserve should at minimum more quickly dial back on its asset purchases and Congress to pause further fiscal stimulus until these overshoots can cool off and be digested because stimulating demand is clearly not the problem anymore, that was a 2020 problem!


Fifth Wave Beginning?
Earlier this summer, the FDA and CDC held back authorizing COVID-19 booster shots for adults over 18 and 6 months after their second dose and instead we got an overly complicated mix of guidelines for those who qualified for booster doses. Interesting enough, many states like California and Colorado went out ahead of the FDA and started authorizing booster doses weeks ahead of the formal FDA authorization. This delay may be costing us as a new COVID wave appears to now be underway and Friday saw the FDA and CDC doing a swift about face to authorize COVID-19 booster shots for those 18+ after 6 months from their 2nd dose. This is embarrassing for the Biden Administration who had been prodding the FDA and CDC to act on authorizing booster doses 3 months ago. Unfortunately, Europe yet again is the epicenter of yet another big COVID wave and countries like Austria are reintroducing punitive lockdown measures. How bad will this current US COVID wave be for hospitalizations and what impact will it have on GDP? Remember that in the summer, 3rd quarter US predictions got as high as over 6% GDP growth while the delta wave flare up actually suppressed growth down to 2%. It’s a very frustrating situation and leaves a lot of open questions for 2022 like how long with these booster doses be good for and are we done with new variants?

S&P Seasonality Chart
So far in 2021, the market perspective has loosely followed historical seasonal patterns which has usually see a strong late November surge. Will patterns repeat this year finishing up with a “Santa Claus” rally? This week saw big tech giants like Apple and Amazon, in particular, hold up the major indexes while distribution occurred below the index levels, especially on Thursday and Friday. All eyes will be on President Biden’s Federal Reserve Chair pick expected early this week which likely will be a market moving event.


Some interesting charts from this past week:
1) Some Early Signs Supply Cost Pressures May Be Starting to Abate
The Harpex Index reflects the worldwide price on the charter market for container ships and showed that containership charter rates fell for the first time in at least 16 months in October in what could be the first sign of container freight rates easing. The Harpex Index rates have continued to roll over and decline so far in November. In addition, the Baltic Dry index index, which provides a benchmark for the price of moving the major raw materials including iron ore, grain, and coal by sea, has now plummeted 46% in just the past month as China has curtailed steel production to conserve energy. You can see in the chart below how parabolic these increases have been compared to pre-pandemic trends.


2) EV Bubble Reflating
Last fall, there was an extraordinary run in all things related to EV’s including automakers, lithium miners, and SPAC’s and it looks like we seeing the same thing again this year. After running hard into year end last year, the spring provided an overdue wake up to massively deflate the EV related stock bubble and I wouldn’t be surprised if the same thing happens again in early 2022, if not earlier. Take a look at recent IPO Rivian who is a pre-production EV company with a shockingly 3rd highest market capitalization ahead of established giants like Toyota and Volkswagen. News even came out on Friday afternoon that the vehicle range for the trucks that Amazon ordered from Rivian have significantly less range than expected. A major caution flag as not every EV company will become the next Tesla! As Elon Musk has said many times, the auto landscape is littered with startups that have failed!
https://www.autonews.com/automakers-suppliers/rivians-electric-van-amazon-might-have-less-range-expected-report-says

3) Semiconductors in Cars
Given all the semiconductor supply chain issues talked up this year, I thought it was interesting to see in a graphic form just how many semiconductor chips are actually being used in the production of modern cars.

Stocks I’m Watching
1) Louisiana Pacific Corp (LPX)
Louisiana-Pacific Corporation, together with its subsidiaries, manufactures and markets building products primarily for use in new home construction, repair and remodeling, and outdoor structure markets. It operates through four segments: Siding; Oriented Strand Board (OSB); Engineered Wood Products (EWP); and South America. The company sells its products primarily to retailers, wholesalers, and homebuilding and industrial businesses in North America and South America, as well as in Asia, Australia, and Europe.
LPX has been putting up some massive earnings beats benefiting from rising commodity prices and ability to pass along cost pressures to its key customers. LPX reported on 11/2 posting a 53% increase in revenue from almost $800 million last year to $1.2 billion this year with EBITDA increasing by 90% year-over-year from $273 million to $522 million (23% margin). LPX has also been an extremely shareholder friendly company with share repurchases and dividend payments to its investors. During the third quarter, LPX returned $416 million to shareholders, comprising $399 million in share repurchases and $17 million in dividends. LPX has a sound balance sheet and trades at a forward P/E of just 6X while sporting 42% operating margins. From a chart perspective, LPX looks to be building the right side of its base readying to go higher with earnings now out of the way.

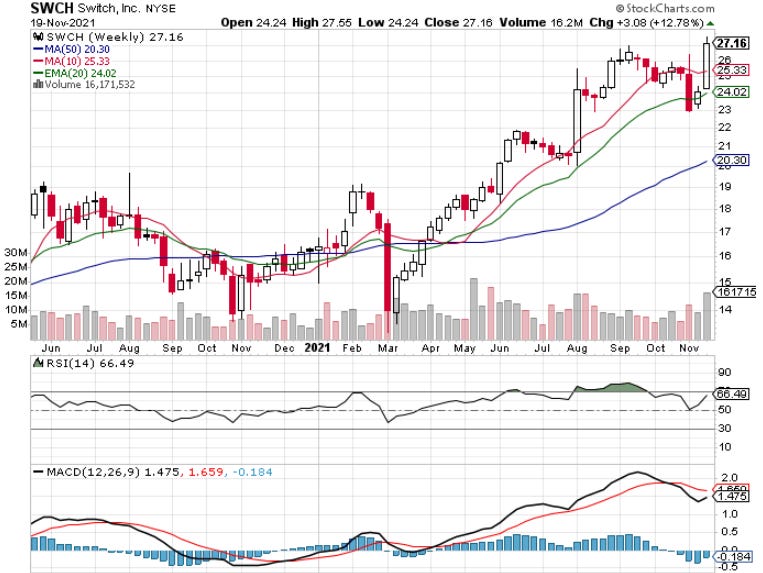
2) Switch (SWCH)
Switch, Inc., through its subsidiary, Switch, Ltd., provides colocation space and related services in the United States. It develops and operates data centers in Nevada, Michigan, and Georgia. The company serves technology and digital media companies, financial institutions, government agencies, and network and telecommunications providers, as well as cloud, IT, and software providers.
There has been some significant M&A activity and interest in the data center sector recently with industry players CyrusOne and Coresite both seeing buyouts last week. Could Switch be next? CoreSite announced that last week that it was being purchased by American Tower, a real estate investment trust (REIT), for $10 billion and KKR, a well-known private equity firm, and Global Infrastructure Partners, a company that invests in infrastructure companies like data centers, both purchased CyrusOne for a 25% premium to its stock price for $15B. Switch had its investor day on 11/15 which was followed by considerable buying interest and volume coming in. Switch is also in the process of transitioning to a REIT expected to be effective in 2023. Although the daily chart is a bit extended, the relative strength and M&A sector interest is notable after its weekly breakout last week.
Switch investor day slides:
https://s23.q4cdn.com/936605801/files/doc_presentations/2021/11/SWCH_INVESTOR_DAY_FINAL_WEB.pdf
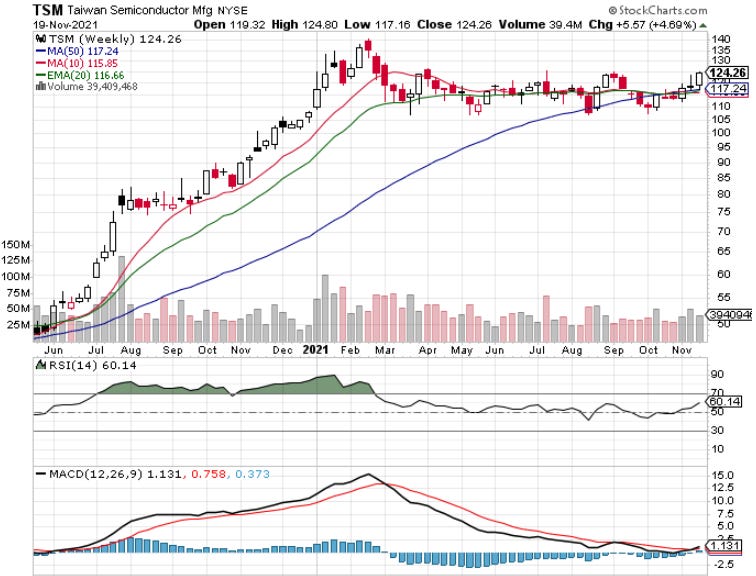
3) Taiwan Semiconductor (TSM
Taiwan Semiconductor Manufacturing Company Limited manufactures and sells integrated circuits and semiconductors. It also offers customer service, account management, and engineering services. The company serves customers in computer, communications, consumer, and industrial and standard segments in North America, Europe, Japan, China, and South Korea.
With the semiconductor (SMH) index powering higher and providing market leadership led by Nvidia, AMD, and Qualcomm, it now looks like TSM wants to get in on the action. There were rumors last week that TSM would likely make the autonomous chip for a future Apple car to add to its existing partnerships. TSM has recently been expanding into doing new foundry deals outside Taiwan and in other countries as many countries seek to leverage TSM’s foundry expertise but locate the foundries within their home countries to alleviate their China and supply chain risk factors. For example, TSM entered into a deal a few weeks ago to co-invest $7B with Sony to build a new chip foundry plant in the southwestern Japanese city of Kumamoto (anticipated to open in 2024) which will be first foundry in Japan for TSM. This comes as Japanese companies Toyota and Nintendo struggled over the past year obtaining semiconductor chips to keep up with production. Similarly, back in May, TSM announced its intentions to invest a staggering $12B to build a chip foundry in Arizona which is expected to also be operational in 2024. TSM is arguably one of the world’s most important companies given its dominating chip foundry market share and the increasing importance of semiconductor supply in various manufacturing applications.
From a chart perspective, TSM is building out the right side of its base and could fill the gap if it clears the $125 price level which has been the key resistance level since it began consolidating its massive year end 2020 run dating back to March. TSM displays stellar fundamentals with a forward 25X P/E, 28% ROE, and over 40% EBIT margins. Street estimates for FY22 are for 19% revenue growth on 69% EBITDA margins. If semiconductors continue to lead, look for TSM to continue moving up through the right side of this base.
Disclaimer:
All investment strategies and investments involve risk of loss. Nothing contained in this website should be construed as investment advice. Any reference to an investment's past or potential performance is not, and should not be construed as, a recommendation or as a guarantee of any specific outcome or profit.