

Weekly Stock Bullfinder- Week of 1/17
Weekly Stock Bullfinder- Week of 1/17
Stocks I'm Watching - Week of 1/17

I hope everyone had a nice weekend!
Protecting Gains (and Mental State!)
Regardless of whether you are a short term trader or long term investor, its important to have written down sell rules and to stick to them to not only protect gains but also your hard earned capital. Written down sell rules avoid the emotional back and forth and mental anguish of figuring out when to sell out or trim existing positions. The best investments over the years for me have been the ones where you don’t need to constantly check your brokerage account because the long term thesis remains and the company continues to perform at or above expectations during its quarterly earnings reports. This often results in the technical and fundamental analysis meshing together for outsized investment returns (easier said than done!). I don’t need to tell anyone that the past 8-10 months in growth stock land have been painful and an anticipate rising interest rate environment will likely continue to put most growth stocks (especially ones without actual earnings) under pressure at least in the near term. Without proper sell rules, growth stock gains can be “round-tripped” or, even worse, you are stuck bagholding “hoping” for the stock to return to at least prior highs or more which could never happen again or take an extraordinary amount of time (which has an opportunity cost for your money). Price anchoring can be avoided with established sell rules.
After doing fundamental analysis first on companies, I then check out the technical chart and prefer to use weekly charts to zoom out and see the overall trend and volume profile. The daily chart has too much noise to evaluate whether the company is going up and to the right. The first criteria I use is whether a company is above at least its 30WK moving average and ideally above its 10WK moving average. This usually signifies the company is a strong uptrend. Below is an example of how I usually apply my sell rules.
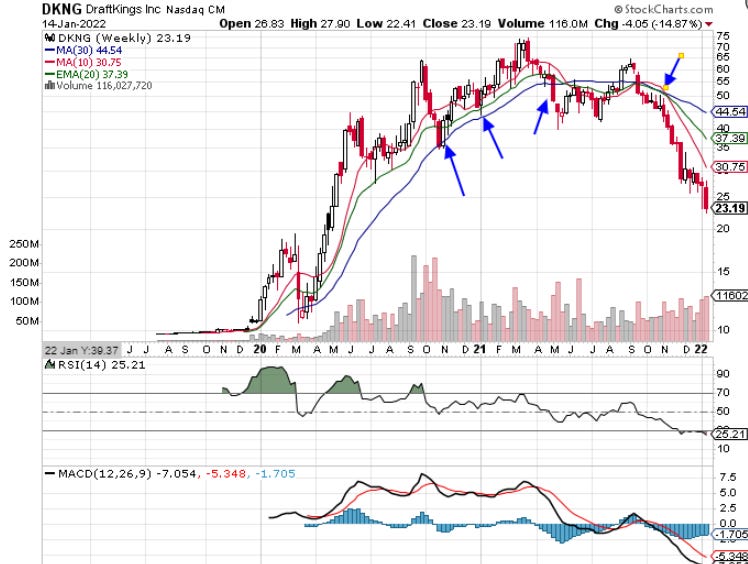
Case Study: Draftkings (DKNG)
Draftkings was on the 2021 Weekly Stock Bullfinder Conviction Buy List at the beginning of the year but it quickly shows signs of losing institutional interest after its first quarter earnings report. Draftkings is a leader in online sports betting and has signed major deals with numerous sports leagues (i.e. NFL, MLB, etc.) to serve as their preferred sports betting provider. In addition, the online gambling and sports betting space has grown exponentially in the US and abroad as more states legalize to bring in new tax revenues. Draftkings saw support at its 30WK moving average in early November 2020, late January 2021, and then broke through this support level on heavy volume in May 2021, a clear sell signal. While it rallied above this level in September 2021 (coinciding with the start of the NFL season), this rally saw a quick undercut and then September through October 2021 saw the previous 30WK moving average turn support into new upward resistance. Since then, Draftkings has seen massive liquidation (more than cut in half) and recently saw back-to-back weeks of above average selling the past two weeks indicating institutions have no interest in holding this name.
What changed? Going into third quarter earnings report in September 2021, Draftkings was trading at an elevated 32X P/S ratio which leaves little margin for error to miss on their earnings report. In addition, I suspect many analysts questioned their buyout offer attempt to purchase Entain Plc for $20B which would have been a massive dilution to existing shareholders. Also, Draftkings continues to spend huge sums of money for marketing and promotional money in order to attract new customers which has resulted in massive losses. The Street has likely questioned this spending strategy (and the payback on Draftking’s customer acquisition cost strategy) which has also since become increasingly crowded by new market entrants. While Draftkings may become a formidable player in the sports betting arena long term, the chart is technically broken and is a hard pass until a new base sets up and emerges. There is no sense to attempt to double down here or catch “falling knives” predicting an eventual bottom because what has gone lower can always continue to go lower.
Midterm Election Years- How Does The Market Historically Perform?
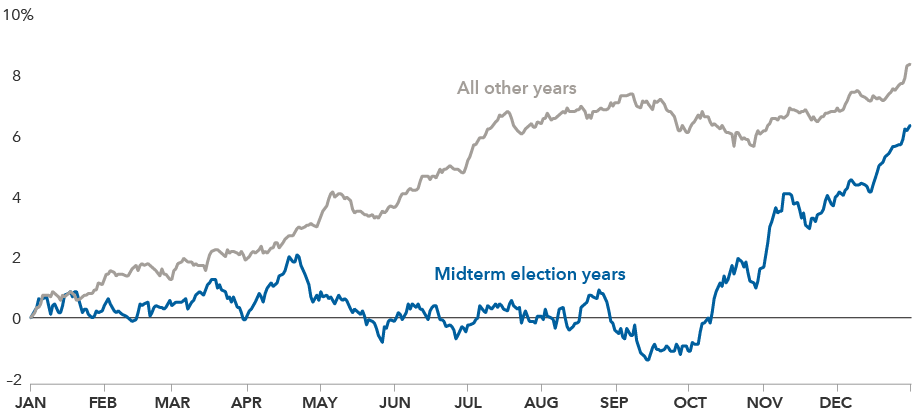
American midterm elections occur every four years, at the midpoint of the four-year presidential term, and usually result in the President’s party losing representation in Congress. 2022 is a midterm election year which will heat up in media attention as the year rolls along. Over the past 21 midterm elections, the President's party has lost an average 30 seats in the House of Representatives, and an average four seats in the Senate. There have only been two occurrences when the President’s party has gained seats in both chambers.
From a market perspective, if you are isolating just the years that a midterm election were held, charts show that investors treat these periods differently than others. In these instances, markets tend to be highly volatile and oscillate for most of the year, gaining little ground until shortly before the elections. This year is also coupled with the removal of unprecedented amounts of fiscal and monetary stimulus which will likely create a very choppy and volatile year. Since 1950, the average 1-year return following a midterm election is 15.1%, more than double that of all other years during a similar period.
Some interesting charts from this past week:
1)Software Sector Market Corrections
Got an iron stomach to handle the volatility? Here is chart showing the last 13 corrections/bear markets in software stocks since 2000. This past week, the closely following software index, $IGV, officially entered bear market territory as it is now down more than 20% from its November 12th 2021 high.

2) Federal Reserve QE Impact
In recent times, the historical Federal Reserve pivot to ending QE has historically resulted in between a -15% and -22% drop in the S&P 500 index. In 2010 it was -15%, in 2012 it was -15%, 2018 it was -20%. In 2011 it was -22% when stocks dropped anticipating the end of QE2 which forced the Fed straight into QE3.

3) Freight Pain
Due to a mix of continued supply chain interruptions and massive fiscal stimulus provided to consumers creating surging durable goods demand, the expenditures component of the Cass Freight Index, which measures the total amount spent on freight, rose to another new record level of 4.419, up 44% y/y in December and 3.4% m/m. Last week, shipping giant Maersk, stated “Unfortunately, 2022 has not started off as we had hoped. The Pandemic still going strong & unfortunately, we are seeing new outbreaks impacting our ability to move your cargo”. Despite rosy media articles of supply chain ports improvement, waiting times at key US ports remain at record waiting times.


Stocks I’m Watching
1)Ultra Clean Holdings (UCTT)
Ultra Clean Holdings, Inc. designs, engineers, and manufactures production tools, modules, and subsystems for the semiconductor and display capital equipment markets in the United States and internationally. The company provides subsystems, such as wafer cleaning modules; chemical delivery modules that deliver gases and reactive chemicals in a liquid or gaseous form from a centralized subsystem to the reaction chamber; frame assemblies; process modules, a subsystems of semiconductor manufacturing tools that process integrated circuits onto wafers; and top-plate assemblies.
A “pocket” of technology stocks bucking the market correction at the moment is semi-cap equipment suppliers. Names include Lam Research ($LCRX), Applied Materials ($AMAT), Nova Ltd ($NVMI), Onto Innovation ($ONTO), Kulicke & Soffa Industria ($KLIC), KLA Corporation ($KLAC), Teradyne ($TER), among others. Last week, semiconductor foundry juggernaut Taiwan Semiconductor ($TSM), said the company would spend between $40 billion and $44 billion on capital expenditures, a huge step up from $30B in 2021, to help ease the chip shortage facing the globe and capitalize on surging global demand for chips. The added production capacity was due to higher demand for high-compute electronics, such as smartphones, electric vehicles and servers. As a result, semicap equipment names like Ultra Clean are again back in favor because most offer below market P/E multiples, pay a modest dividend, and $TSM just told everyone a huge secular bull market for capex spend will be in place for at least 2022 and likely beyond. On Friday, fund money came rushing into semi cap names with the companies cited above seeing above average volume increases. Ultra Clean is sitting just below is weekly breakout level ($63.64) moving up the right side of its base extending back to last spring. Ultra Clean is also a consistent earnings performer and is currently trading at just 9X forward P/E, a significant discount to the larger market. Semi cap peers are already in nice uptrends, so I am looking for Ultra Clean to see if it can join in the party.
Latest investor presentation: https://seekingalpha.com/article/4479709-ultra-clean-holdings-uctt-investor-presentation-slideshow

2)Cheniere Energy Partners (CQP)
Cheniere Energy Partners, L.P., through its subsidiaries, owns and operates regasification facilities at the Sabine Pass liquefied natural gas (LNG) terminal located in Cameron Parish, Louisiana on the Sabine-Neches Waterway. The company’s regasification facilities include infrastructure of five LNG storage tanks with an aggregate capacity of approximately 17 billion cubic feet equivalent; two marine berths that accommodate vessels with capacity of up to 266,000 cubic meters; and vaporizers with regasification capacity of approximately 4 billion cubic feet per day. It also owns a 94-mile pipeline that interconnects the Sabine Pass LNG terminal with various interstate pipelines.
Cheniere is providing a critical role at the moment to provide gas-starved Europe with natural gas while also offering a 6.9% distribution yield. Thanks to the completion of a major growth project that has gone online this first quarter (year ahead of the guaranteed completion), CQP has provided guidance for a distribution of $3.00-$3.25 in 2022. Cheniere's has long term distribution contracts which feature a fixed fee per MMBtu of LNG, but also include a variable component equal to 115% of Henry Hub prices per MMBtu. With Henry Hub surging higher over recent months, the company's variable margins have received a nice boost and distributions could be increased once 1Q results are announced. In fact, 7% of 2022 production is exposed to variable price increases while the long term agreements provide earnings stability. From a technical standpoint, Cheniere has rising weekly RSI and has no overhead resistance after its recent weekly breakout.

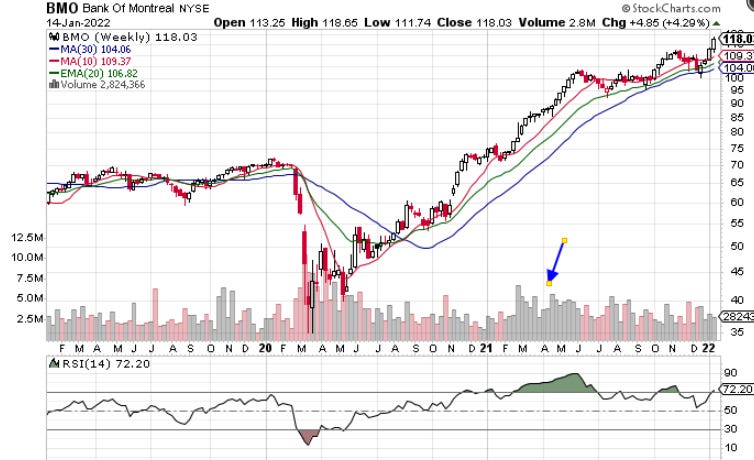
3) Bank of Montreal (BMO)
Bank of Montreal provides diversified financial services primarily in North America. The company’s personal banking products and services include checking and savings accounts, credit cards, mortgages, and financial and investment advice services; and commercial banking products and services comprise business deposit accounts, commercial credit cards, business loans and commercial mortgages, cash management solutions, foreign exchange, specialized banking programs, treasury and payment solutions, and risk management products for small business and commercial banking customers. Bank of Montreal is the fourth largest of the Big 5 Canadian banks and is the 8th largest in North America by assets.
Many Canadian banks, like Bank of Montreal, are in nice established uptrends and have become income favorites for investors who prize low volatility and growth. They may not be the “sexiest” names out there but are bucking the overall market weakness especially as interest rate increases from the Federal Reserve and Canada’s central bank kick in this year. Check out the massive accumulation which occurred from February through early July last year in this name. After going sideways a bit after consolidating its big move, BMO is now again in a clear resumption of its uptrend after its recent weekly breakout. BMO has produced a 14% CAGR (including dividends) over the past 26 years and recently increased its dividend by 25% (Management has a longstanding commitment to paying out 40-50% of its earnings). BMO has paid a dividend every three months since 1836, without interruption. BMO also recently announced the acquisition of Bank of the West from BNP Paribas to further its US expansion. In its most recent quarter, BMO’s fourth quarter adjusted EPS grew 38%YoY coupled with a strong return on equity of 16%.
Disclaimer:
All investment strategies and investments involve risk of loss. Nothing contained in this website should be construed as investment advice. Any reference to an investment's past or potential performance is not, and should not be construed as, a recommendation or as a guarantee of any specific outcome or profit.