

Weekly Stock Bullfinder- Week of 1/24
Weekly Stock Bullfinder- Week of 1/24
Stocks I'm Watching - Week of 1/24

I hope everyone had a nice weekend!
Buckle Up- “Garden Style” Correction or Something More Brewing?
Two weeks ago, I commented on the incredible divergence that had been continuing to build between underlying stocks outside of the indexes and how the indexes were being held up primarily by mega cap stocks over the second half of 2021 (think “FANG” complex). Well, we saw the first cracks last week. After reporting earnings, Netflix shares tumbled 21.8% Friday after reporting slowing user growth numbers while alluding to rising competition in the streaming space and rising content costs. It marked Netflix’s worst market performance day since July 25, 2012, when shares fell 25% and finished the day with with a 10 (!) reading on the 14d RSI, the lowest reading since 2011. The potential problem bubbling up is Federal Reserve Chairman Jay Powell’s press conference on Wednesday coupled with a surge of reporting from mega cap companies this upcoming week. A perceived hawkish Federal Reserve and some earnings report misses from the “generals” (Microsoft, Apple, Tesla, etc.) could result in a powerful downdraft especially with the QQQ index now firmly sitting below is 200 day moving average. I posted last week a chart that shows that the Federal Reserve ending QE historically has resulted in resulted in anywhere between a -15% and -22% drop in the S&P 500 index before the Federal Reserve “capitulates” and changes course back to monetary easing. Currently, we are only at 8.75% off the 52 week for the S&P 500 so about halfway there from what the historical drawdown has been when Federal Reserve pivots have occurred. However, over the past decade, we have never had an enormous inflation problem like we have today which may make it difficult for the Fed to swing back around and restart QE if the economy slows and market takes a bath. This puts the Fed in a difficult position between balancing its dual mandate between stable prices and maximum employment.
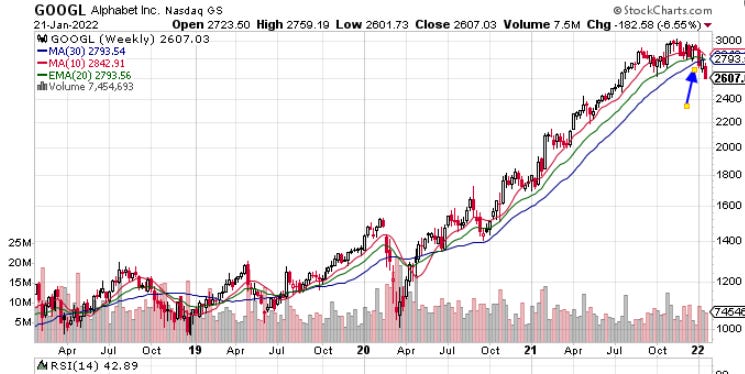
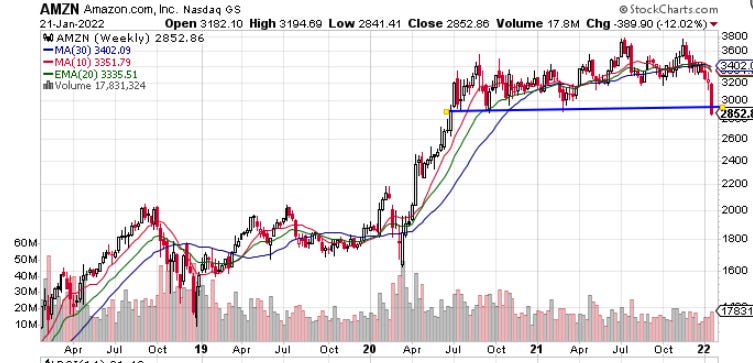
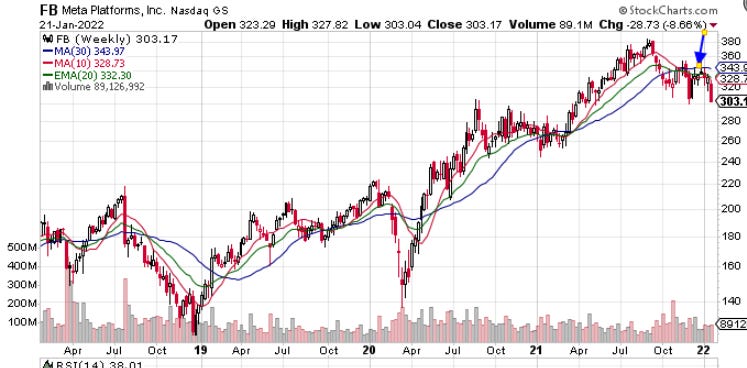
I snipped some charts of the “generals” which are rolling over or already have started their downtrend. Alphabet had a banner year in 2021 going up 65% and it makes sense for it give some back (even though it has a forward P/E of 19X). Amazon and Meta (formerly known as Facebook) look in the roughest shape in my opinion going into earnings. Meta doesn’t report this week (reports next week Wednesday February 2nd) but it looks very bearish. I am wondering how Meta’s investment base will tolerate what seems to be a very heavy investment cycle up ahead to build out its Metaverse project and how this will continue to weigh down its reported EPS. Amazon had been consolidating sideways all of last year but broke decisively below this consolidation box last week on heavy volume. This quarter, I am wondering if Amazon’s COVID expenses have eased up and if their forward guide is again disappointing given the massive pull forward of e-commerce shopping during this pandemic. What the chart information tells me is that these pullbacks are likely the start of the left side of a new base that needs to form after a correction runs it course. Since these “generals” have such big contributions to the market weights, a sizeable correction in one or more of these names (especially a Netflix style post-earnings smackdown like we saw last week) could lead to more blood in the indexes. Apple and Tesla charts look OK at the moment but Apple just eclipsed a $3T market cap but forward estimates for FY22 call for just 5% revenue growth and a meager 1% EBITDA growth. I am not overly bearish going into this year but the change in character observed so far in early 2022 is noticeable especially with all sectors except for energy and pockets of financials getting taken to the woodshed. If the current market correction picks up steam, it will be interesting to see if increased M&A activity occurs in beaten down names (especially in social media names like Pinterest and Snap, broken down fintechs like Paypal and Upstart, gambling companies like Draftkings, etc.). Perhaps Jay Powell will help calm the markets on Wednesday but the playbook seems pretty clear for 2022: QE ends and interest rates will be hiked until the earliest of either inflation abating or market/economy breaking, whichever comes first.
Alphabet
Amazon
Meta Platforms (formerly known as Facebook)

Some interesting charts from this past week:
1) Cash Burning Russell 3000 Stocks
Here is a research chart that Goldman Sachs put out this past week of Russell 3000 stocks with weak balance sheets and high free cash flow burn. Not surprising, bloated EV stock Rivian takes the cake with Nikola not far behind. I wouldn’t be surprised to see Rivian continue to waterfall in 2022 given its outsized valuation and lots of articles swirling about the performance reliability of its vehicles.

2) Retail Sales Forecast
UBS predicts US softline retail sales will fall apart by April due to inflation concerns by the consumers combined with hangover effect from lack of further fiscal stimulus check programs.
"Real disposable income in the US is now 3% below its pre-COVID trend, reflected in the weak retail sales numbers last week. Despite nominal wage growth, real wages at -2% are the weakest since the global financial crisis:"- Deutsche Bank

3)Homebuilding Costs- YoY Price Increases
Below is a graph showing home builder construction cost increases in 4Q-2021 (materials & labor YOY). If you’re wondering about that +135% YOY “Other” category, it includes garage doors (which have had nightmare supply chain issues).

Stocks I’m Watching
While there could certainly be a oversold bounce this week, here are some nasty bearish charts shaping up.
1) Fedex Corp (FDX)
FedEx Corporation provides transportation, e-commerce, and business services in the United States and internationally. The company’s FedEx Express segment offers express transportation, small-package ground delivery, and freight transportation services; time-critical transportation services; and cross-border e-commerce technology and e-commerce transportation solutions. Its FedEx Ground segment provides day-certain delivery services to businesses and residences. The company’s FedEx Freight segment offers less-than-truckload freight transportation services.
After a high volume breakdown last October, Fedex has rallied back to its 30WK moving average which was previously support in early 2021 and appears to be rolling back down. Weekly RSI is now below 50 and is turning down.

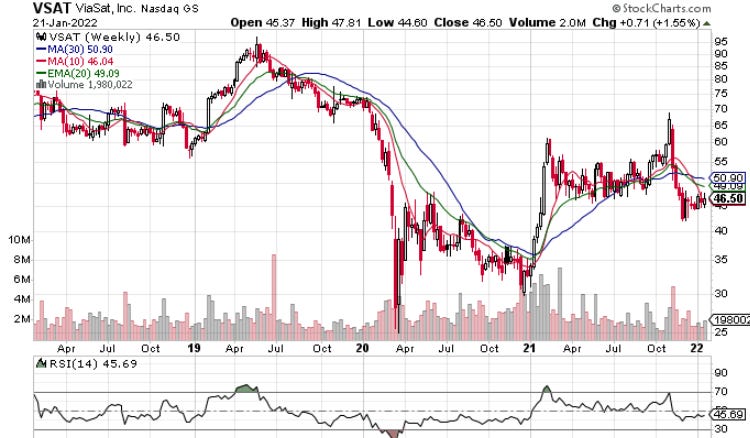
2) Viasat (VSAT)
Viasat, Inc. provides broadband and communications products and services worldwide. The company’s Satellite Services segment offers satellite-based fixed broadband services, including broadband internet access and voice over internet protocol services to consumers and businesses; in-flight entertainment, internet, and aviation software services to commercial airlines; community internet services; mobile broadband services, including satellite-based internet services to energy offshore vessels, cruise ships, consumer ferries, and yachts; and advanced software and communication infrastructure services, which include ultra-secure solutions IP connectivity, bandwidth-optimized over-the-top applications, industrial internet-of-things big data enablement, and industry-leading machine learning analytics.
Viasat has formed a nasty bear flag on its weekly chart and has a weekly RSI below 50. Couple this with the face that SpaceX's Starlink and Amazon's Project Kuiper are expected to be launched soon which will likely to make the going tough for smaller companies like Viasat. If market share is rapidly taken by SpaceX, Viasat could be in big trouble especially with its big debt load. Goldman Sach’s has forecasted negative free cash flow of $380M in 2022 and Viasat already trades at TTM P/E of 97X.
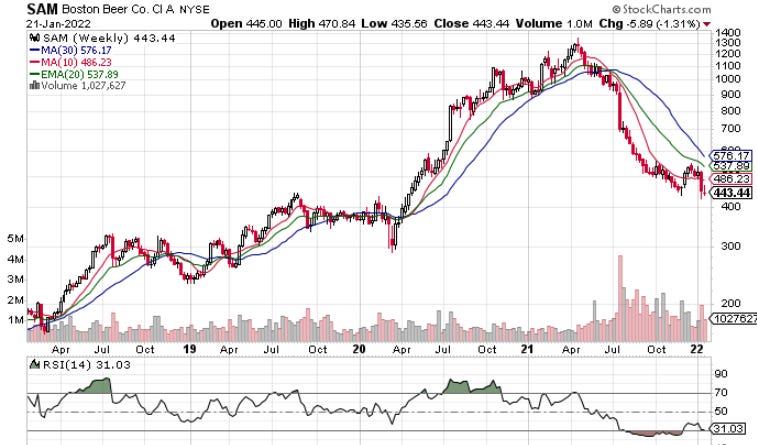
3) Boston Beer Co (SAM)
The Boston Beer Company, Inc. produces and sells alcohol beverages primarily in the United States. The company’s flagship beer is Samuel Adams Boston Lager. It offers various beers, hard ciders, and hard seltzers under the Samuel Adams, Twisted Tea, Truly Hard Seltzer, Angry Orchard, Dogfish Head, Angel City, Coney Island, Concrete Beach brand names. The company markets and sells its products to a network of approximately 400 wholesalers in the United States, as well as international wholesalers, importers, or other agencies that in turn sell to retailers, such as grocery stores, club stores, convenience stores, liquor stores, bars, restaurants, stadiums, and other retail outlets.
Boston Beer benefited from a sales surge during the pandemic from its hit Truly hard seltzer drink lineup which has been quickly commoditized by other beverage makers making copy-cat versions. In its recent earnings report, Boston Beer said it now expects 2021 EPS to be between a loss of $1 and income of $1, down from its prior EPS guidance of $2-$6/share leading to another round of puke selling. Gross margins fell to 30.7% from 48.8% in Q3 2020 and 45.7% in Q2 2021 due to high indirect and supply chain costs. Notice the incredible high volume distribution selling occuring all summer of last year. Every rally to its 10WK moving average has been meet with more selling has pushed this name lower and lower. At sound point there will be tradeable bottom (since its core craft beer lineup is good), but this chart looks incredible bearish with the next stop weekly support around $400 level. I wouldn’t be surprised if this becomes a takeover target the lower it goes.
Disclaimer:
All investment strategies and investments involve risk of loss. Nothing contained in this website should be construed as investment advice. Any reference to an investment's past or potential performance is not, and should not be construed as, a recommendation or as a guarantee of any specific outcome or profit.