

Weekly Stock Bullfinder - Week of 3/25
Weekly Stock Bullfinder - Week of 3/25
Stocks I'm Watching - Week of 3/25

Hope everyone had a nice weekend!
Online Sports Betting- More than Just “March Madness”?
“March Madness”, the National Collegiate Athletic Association’s (NCAA) college basketball tournament kicked off this past week and estimates from the American Gaming Association (AGA) call for total U.S. wagering to amount to more than $7.2B for this years men’s and women’s national tournaments using legalized sportsbooks. This amount represents almost twice the amount of wagering on the NFL’s Super Bowl game. US sports betting has quickly grown into a $10 billion industry since a 2018 Supreme Court’s decision allowed US states to legalize the practice. Online sports betting (OSB) is now legal in 38 states and Washington D.C. while six states, Alabama, Georgia, Hawaii, Missouri, and Oklahoma, have legislation currently pending that would legalize OSB. Goldman Sachs Research estimates suggest that OSB is in its “middle innings” and Americans will ultimately spend almost $45B on sports betting annually when the OSB reaches its maturity. Goldman Sachs Research forecasts a 40% CAGR for U.S. OSB from 2018-2033 as its remains a high growth secular trend sector.
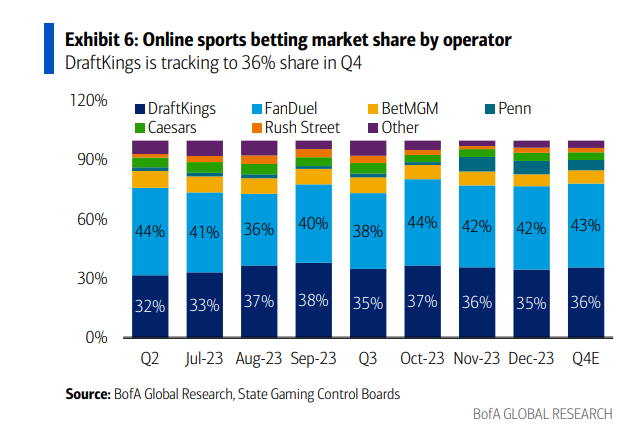
With 5 years of data now to analyze since the Supreme Court’s groundbreaking ruling, where does the online sports betting market stand today? According to Bank of America Global Research and State Gaming Control Boards, online sports betting market share is increasingly concentrated within Flutter Entertainment’s (FLUT) FanDuel product and DraftKing’s (DKNG), which together represent a commanding ~75-80% operator market share. Notably, OSB apps which have been rolled out by larger casino players such as MGM (BetMGM) and and Caesar’s (Caesar’s Sportsbook) have not gained material market share and only have small single digit OSB market share today. Data trends continue to suggest that an emerging duopoly between FanDuel and Draftkings is emerging in the OSB segment.
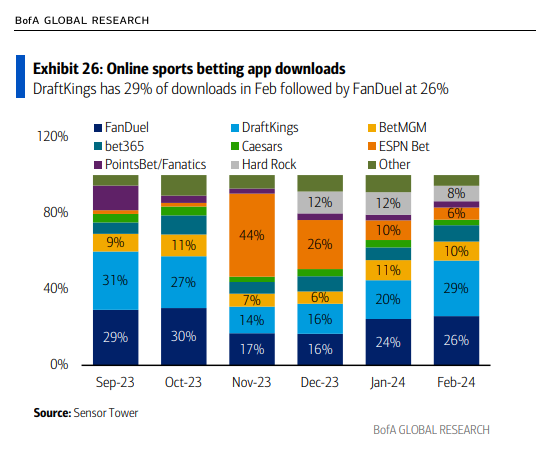
In addition, SensorTower Data from January 2024 suggests that FanDuel and Draftkings continue to garner almost ~50% of all online sports betting app downloads on a trailing 6 months basis. Notably, during the NFL Super Bowl weekend, SensorTower app download data showed that Draftkings had ~40% market share of total OSB app downloads for betting on the big sporting event. OSB handle growth continues at a torrid pace as OSB handles have now grown over 40% YoY in the past two quarters.
During its November 2023 investor day event, Draftkings shared some interesting insights into the state of its business including:
-All state vintages (2018-2019, 2020-2021, 2022-2023) are inflecting to show positive contribution profit within 2-3 years from initial rollout. In addition, newer state vintages (2022-2023 states) are now generating positive contribution profit on average for Draftkings within 5 quarters compared to 2020-2021 vintages of 8 quarters.
-Existing online sports betting handles continue to grow at a rapid organic growth pace after state rollout. For example, 2018-2019 state vintages and 2020-2021 state vintages grew 29% and 32%, respectively in 2023.
-Customer acquisition costs continue to rapidly decline for Draftkings. Draftkings customer acquisition costs have now declined 20% CAGR since 2021 which, while maintaining strong market share, suggests the power of its branding and scalability of its business. As a result, the customer acquisition payback period has now declined to only 2.3 years for customers acquired in 2023, down from 3 years for customers acquired in 2021.
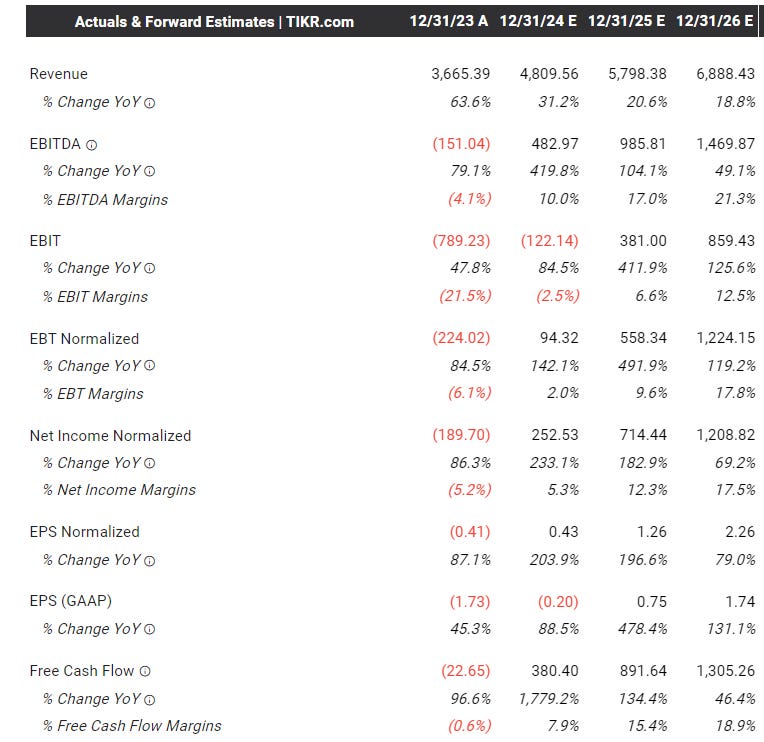
Similar to Celebrite DI (CLBT) covered in last week’s newsletter, Draftkings (DKNG) is another previous SPAC IPO listing which is appearing more and more as a company who simply went public at the wrong time (along with an extraordinarily high valuation (31X P/S!) reflective of the manic capital markets SPAC phase of 2020-2021). While still expensive (trading at 110X forward P/E), Draftkings is showing signs that it can benefit from organic growth (state legalization and repeat customer monetization) while also reigning in high customer acquisition costs that have increasingly shortening investment payback periods. Previously, Draftkings was dogged by Wall St analysts which challenged its heavy customer acquisition costs to gain market share (which resulted in heavy GAAP losses during this “investment” phase) while questions remained as to how “sticky” OSB consumers would be (i.e. would they just chase the latest and greatest OSB app promotion?). However, Draftkings fundamentals appear to be hitting an inflection point as improved economics are now being reflected in its forward consensus estimates and it continues to grow into its valuation. Specifically, EPS and free cash flow estimates are expected to surge over the next few years and beyond with mid teens free cash flow % yields (see chart below). Meanwhile, it has emerged as a key player in the OSB duopoly between itself and FanDuel as other new entrants have struggled to make meaningful dents in its OSB market share. Recently, Disney (DIS) has sold its prior investment holdings in Draftkings (for a cool $90M gain!) as it has now partnered with Penn Sportsbook in attempts to compete with Draftkings using its ESPN Bets handle. However, given the fact that large casino players (MGM, Caesars, etc.) have struggled with low single digit OSB market share, and if Disney’s foray with ESPN Bets does not pan out, Draftkings could make for an interesting acquisition target for deep pocketed industry competitors in the future.
Draftkings November 2023 Investor Presentation:
https://draftkings.gcs-web.com/static-files/b6f14c7f-f4dd-4fcb-8c3c-637de5db2afb
Relative Strength Update
Communication Services (XLC) +8, Technology (XLK) +4, Cloud Computing +5, and Industrial (XLI) +4 groups all showing improving relative strength over the past two weeks. US Home Construction (ITB) and Semiconductors (SOXX) continue their strong market leadership runs.

Quotes of the Week
1) “We are in the very early innings of a multiyear growth phase driven by AI as this disruptive technology will transform every aspect of business and society. The race is on to create artificial general intelligence, or AGI, which will require ever-increasing model sizes with trillions of parameters. On the other end of the spectrum, there is considerable progress being made on improving AI models, so that they can run on edge devices, like PCs and smartphones, and create new and compelling capabilities. As AI training workloads remain a driver of technology and innovation, inference growth is also rapidly accelerating. Memory and storage technologies are key enablers of AI in both training and inference workloads, and Micron is well-positioned to capitalize on these trends in both the data center and the edge. We view Micron as one of the biggest beneficiaries in the semiconductor industry of this multiyear growth opportunity driven by AI….Customers continue to give strong feedback that our HBM3E solution has a 30% lower power consumption compared to competitors' solutions. This benefit is contributing to strong demand. Our HBM3E product will be a part of Nvidia's H200 Tensor Core GPUs, and we are making progress on additional platform qualifications with multiple customers….We are on track to generate several hundred million dollars of revenue from HBM in fiscal 2024 and expect HBM revenues to be accretive to our DRAM and overall gross margins starting in the fiscal third quarter. Our HBM is sold out for calendar 2024, and the overwhelming majority of our 2025 supply has already been allocated.”
-Sanjay Mehrotra, CEO, Micron Technology (MU)
2) “As we turn the page on the calendar year, we saw another turn of the dial constraining spending by our clients, including spending on our services, particularly in parts of EMEA and North America. This was evident in the composition of our new bookings, which came in differently than expected. We see clients continuing to prioritize investing in large-scale transformations which convert to revenue more slowly, while further limiting discretionary spending particularly in smaller projects. We also saw continued delays in decision-making and a slower pace of spending.”
-Julie Sweet, CEO, Accenture plc (ACN)
3) “The quarter started well with strong holiday performance in December, but unfavorable winter weather negatively impacted January traffic. And while February results improved, we experienced some underlying softness we had not seen in the months leading up to January. The lower income consumer does appear to be pulling back, and the mix of guests based on income is now in line with pre-COVID….We're clearly seeing consumer behavior shifts. Our data shows we're essentially back to our normal pre-COVID mix across all income groups. But specifically your question, for the third quarter, transactions from households with incomes above $150,000 were higher than last year. Transactions from incomes below $75,000 were much lower than last year. And at every brand, transactions fell from incomes below $50,000. Similar to Q2, this shift was most pronounced in our fine dining segment…”
-Rick Cardenas, CEO, Darden Restaurants (DRI)
Some interesting charts from this past week:
1) Software Sector- Growth Guidance
The chart below was published by JP Morgan Research and shows the software sector growth guidance comparison to FY24 consensus and actual FY23 growth rates. Growth rates have continued to drift lower for most software companies, as only 1 company below has guided above consensus for CY24 growth, and most have guided ~1% below.

2) Data Center Power Growth
According to the Boston Consulting Group (BCG), data centers currently represent 2.5% of total U.S. electricity consumption. By 2030, BCG expects energy use to grow from 126 TWh to 335 TWh, or demand of 17 GW to 45 GW. At this higher end of their estimates, BCG estimates that data centers could consume 7.5% of all electricity in the U.S. New generative artificial intelligence (GenAI) is a significant driver of BCG’s estimate, with 2 GW of GenAI-related load in the base case and possibly an additional 7 GW of GenAI load online by 2030. Virginia hosts the largest data center market in the world and is home to more than 35% (~150) of all known hyperscale data centers worldwide. Ground zero for this data center growth is in Loudoun County, Virginia – commonly referred to as “Data Center Alley.”

3) Mortgage Rates Composition by Country
According to data compiled by ResiClub, the US home market is unique compared to other countries in that a staggering 96% of residential mortgage debt in the U.S. is in the form of long-term (often 30 years) fixed interest rate debt. In other countries such as Finland, almost 95% of residential mortgage rate debt is variable rate. These differences highlight how global central bank interest rate policy transmission can have very differing impacts across the globe depending upon the consumers sensitivity to interest rates changes.


Stocks I’m Watching
Honorable mentions that didn’t make the final cut: CCS, OWL, NXPI, GS, CXT, OBE.TO, CIVI, MGY, WMS, CLF, FRU.TO, LYB, DRI, CAN, OMF, NTAP, MNDY, MEDP, BECN, LNW, FROG, MFC, SQSP, WIX, PIPR, DINO, LPX, BX, FND, TREX, AVDX, PRU, UEC, SPG, MTDR, TALK, CALF, AIT, WMB, TFII, WOR, BX, CXW, LOW, HD, TILE, CMC, TFC, TEL, RSPG, JHG, RDNT, BCC, LPX, PSO, UTI, AVDX, STX, SDHC, DSP, RJF, UFPT, VRTS, DSGX, CARR, CSX, ARCB, DVN, CVI, NOG, PR, OXY, ALV, UBER, MNMD, CRVL, MGY
1) Pool Corporation (POOL)
Pool Corporation distributes swimming pool supplies, equipment, and related leisure products in the United States and internationally. Pool Corp is the world’s largest wholesale distributor of swimming pool and related backyard products.
Pool Corp is flashing signs it wants to work up the right side of its weekly base buoyed by recent positive housing construction data. Specifically, single family homebuilding data in February showed permits up 1% MoM and the highest level of single family permits since May 2022 while single family housing starts were up 11.6% MoM, the high level since April 2022, with single family housing completions up 20% MoM. The home builder data aligns with NAHB home builder sentiment crossing the 50 level last week and improving for the 4th consecutive month. Pool generates about 17% of its revenue from building new pools, 22% of its revenue from remodeling or reconstruction work, and about 61% of its revenue from maintenance and service work and is impacted by changes in interest rates and the cyclical nature of the housing market. Pool underwent a significant post-COVID buying binge price correction (at one point in July 2020 it traded at 36X forward P/E) and now trades at a forward P/E of 23X. It has proven itself as a serial compounder, up 587% in the past 10 year for a CAGR of 21.5%.

2) Stifel Financial Co (SF)
Stifel Financial Corp., a financial services and bank holding company, provides retail and institutional wealth management, and investment banking services to individual investors, corporations, municipalities, and institutions in the United States and internationally.
According to Refinitiv data, 2023 was a difficult year for investment banks as global M&A activity fell 17%, the lowest level in 10 years but Morgan Stanley expects global M&A volumes to rise 50% versus 2023, as leading indicators flash green including banks pointing to deal pipelines building and headwinds to corporate confidence ease. In addition, capital markets appear to be loosening up as IPO’s return (such as Reddit, etc.) As a result, capital markets beneficiaries including Piper Sandler (PIPR), Jeffries (JEF), Raymond James (RJF), Lazard (LAZ), Goldman Sachs (GS), and Evercore (EVR) are all in strong uptrends. Stifel boasts strong fundamentals trading at a forward P/E of 11.5X, with consensus FY24 EPS growth estimates of 41%, while it increased its dividend 16.7% last quarter to $0.42/sh. From a technical perspective, Stifel has formed a weekly cup and handle and is sitting at its 10WK support.

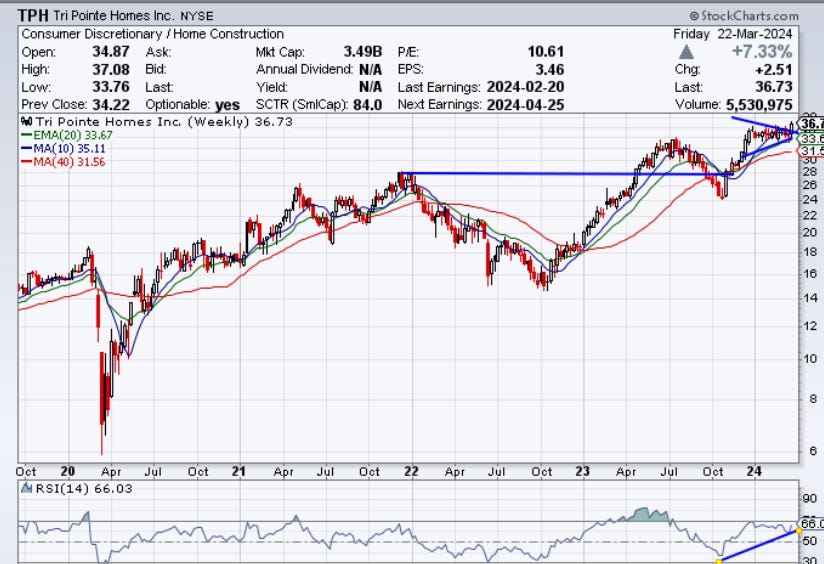
3) Tri Pointe Homes (TPH)
Tri Pointe Homes, Inc. engages in the design, construction, and sale of single-family attached and detached homes in the United States.
Tri Pointe Homes had a breakout last week from a tight multi-monthly consolidation dating back to December 2023 and recently received an upgrade from RBC Capital Markets to an “Outperform” rating on the basis of an improved pricing outlook which could support upside to its gross margin and EPS analyst estimates. RBC noted that Tri Pointe Homes saw healthy breadth of MoM price increases on 44% of base floor plans vs. the peer group’s 32% due to solid demand. Tri Pointe also boasts strong fundamentals after it announced last quarter that its net new home orders increased 143% to 1,078, its backlog units increased 58% to 2,320, and its backlog dollar value increased 38% to $1.6B. This has caused Tri Pointe to guide to a 17% YoY increase in deliveries during 2024 benefiting from a continued mortgage interest rate “lock in” effect from the resale market. The tale of two housing markets has continued in 2024, as the new home market and related homebuilders continue to outperform the existing-home market. Builders have been benefitting from the lack of resale inventory and from their ability to use incentives such as mortgage rate buydowns to entice buyers off the sidelines. After a shakeout below its 40WK moving moving average, Tri Pointe buyers were quick to step in as it looks to move higher along with the overall relative strength of the homebuilder peer group.
Disclaimer:
All investment strategies and investments involve risk of loss. Nothing contained in this website should be construed as investment advice. Any reference to an investment's past or potential performance is not, and should not be construed as, a recommendation or as a guarantee of any specific outcome or profit.