

Weekly Stock Bullfinder - Week of 6/27
Weekly Stock Bullfinder - Week of 6/27
Stocks I'm Watching - Week of 6/27

I hope everyone had a nice weekend!
Ukraine “War Premium” Unwinding
The Ukraine/Russia war has been the significant geopolitical event this year that has dominated market headlines with the different twists and turns of sanctions, threats, and political press conferences that have led to market moving changes and positioning in certain sectors and their related stocks. There is now emerging evidence that the market has digested the “war premium” for many of these post-invasion moves and many areas are now breaking down in the face of concerns over macro GDP growth. One of the more significant areas impacted by the invasion of Ukraine was the agricultural sector. However, wheat prices which initially surged 60% higher upon Russia’s invasion, consolidated sideways, and has now broken lower but are still up 23% from pre-invasion prices. Similar moves have been observed in other agricultural commodities like soybeans.

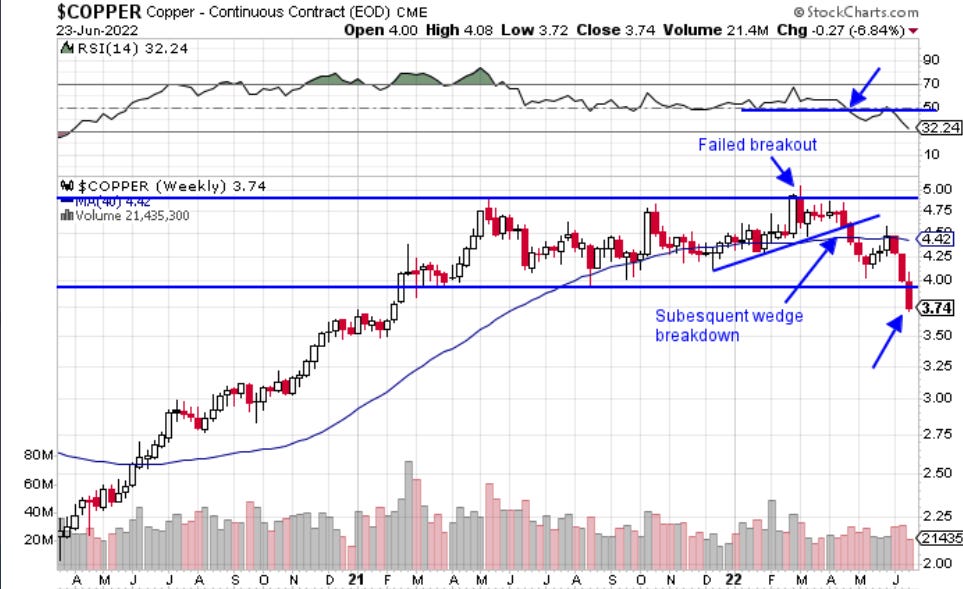
Industrial and precious metals such as steel, gold, copper, palladium, etc. also saw significant post-invasion moves over supply concerns but now exhibit similar breakdown patterns to the agricultural sector. For example, take the copper chart below which broke down below the critical $4 price support level last week after a failed breakout. Copper is widely viewed as a economic bellwether and is on track for its worst quarterly performance since the 2008 financial crisis.
Energy remains the wild card at the moment as significant year to date outperformance has cooled off significantly with many energy names seeing 20-30% swift corrections in a matter of the past 2 weeks.
“The European Union still has six months to go before its ban on Russian crude and refined product imports takes effect, but indications so far are that the continent isn’t rushing to replace Russian oil. After initial steps to limit crude imports shortly after Russia invaded Ukraine in late February, efforts to wean off Russian oil through self-sanctioning have stalled. In fact, shipping data show that Europe is currently buying even more Russian diesel and other products than it did last year.” - Energy Intelligence
New data from Energy Intelligence and other sources has been showing the past few months the perceived supply loss of Russian crude oil to the world oil market is not actually happening and that supply is just being redirected to willing buyers that are not signed up to the sanctions. Shipping data has showed that Russia's oil exports are back to pre-war levels as India & China buy up all the Russian oil they can at a discount ($70-$80/barrell). In addition, new risks such as global recession fears, re-start of Iran nuclear deal talks, and President Biden’s upcoming visit in July to Saudi Arabia have all combined to pressure oil prices. As a result, major energy ETF’s have seen significant outflows the past few weeks that have largely rotated into biotech, chinese, and healthcare stocks. Will energy rollover here and further reduce inflation pressures or will we get a shakeout and false breakdown as the summer rolls on?

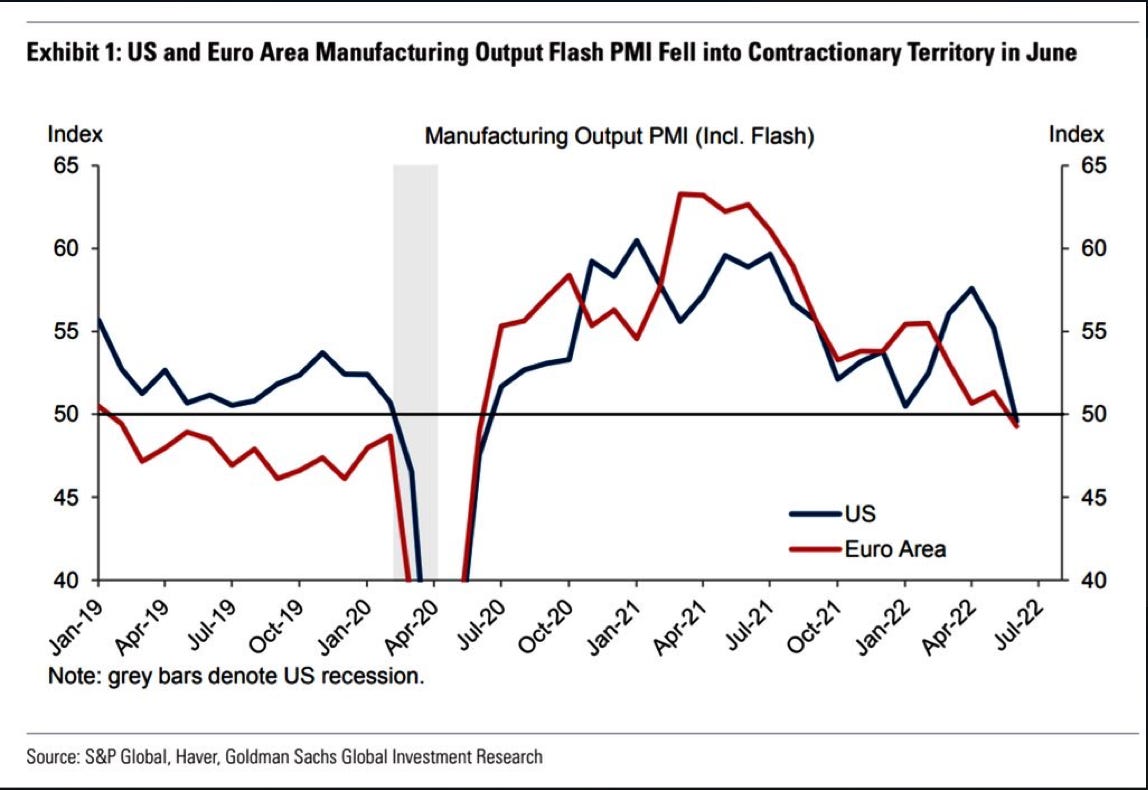
Recession fears appeared to have replaced inflation fears for the moment as commodity prices have pulled back and leading PMI data has shown concerning trends in US and Euro Zone manufacturing trends heading firmly into contraction (<50). In addition, other economic gauges like consumer sentiment continues to plunge to make new record lows. Europe continues to struggle with skyrocketing inflation and is in the midst of an energy crisis as the fall/winter approaches. When the Federal Reserve was easing monetary policy the past few years, “misses” in economic data like PMI’s and other economic gauges were cheered by the stock market as it was interpreted that easy money policy and interest rates would remain muted as the Federal Reserve stayed accommodative. However, the opposite is true today as softening (some would argue collapsing) leading economic indicators are met with an overly hawkish Federal Reserve set on an aggressive interest rate hiking path the rest of the year with no imminent fiscal stimulus on the horizon. This is an unfavorable combination at the moment to the equity markets. As a result, this is why I remain skeptical that bounces in more speculative areas such biotech and chinese stocks will be sustained in this environment. Hallmarks of bear markets consist of multiple strong rallies to resistance areas and earnings revisions have not yet come down to reflect the significant cooling in the global economy.

Some interesting charts from this past week:
1) Real Consumer Spending- Dipping Negative in May
According to Bank of America analysis and calculations, the inflation-adjusted (real) total credit card consumer spending has slipped into the negative territory for all three income groups in May. Given that consumer spending comprises 70% of US GDP, this is a trend worth watching as recession fears grip the market.

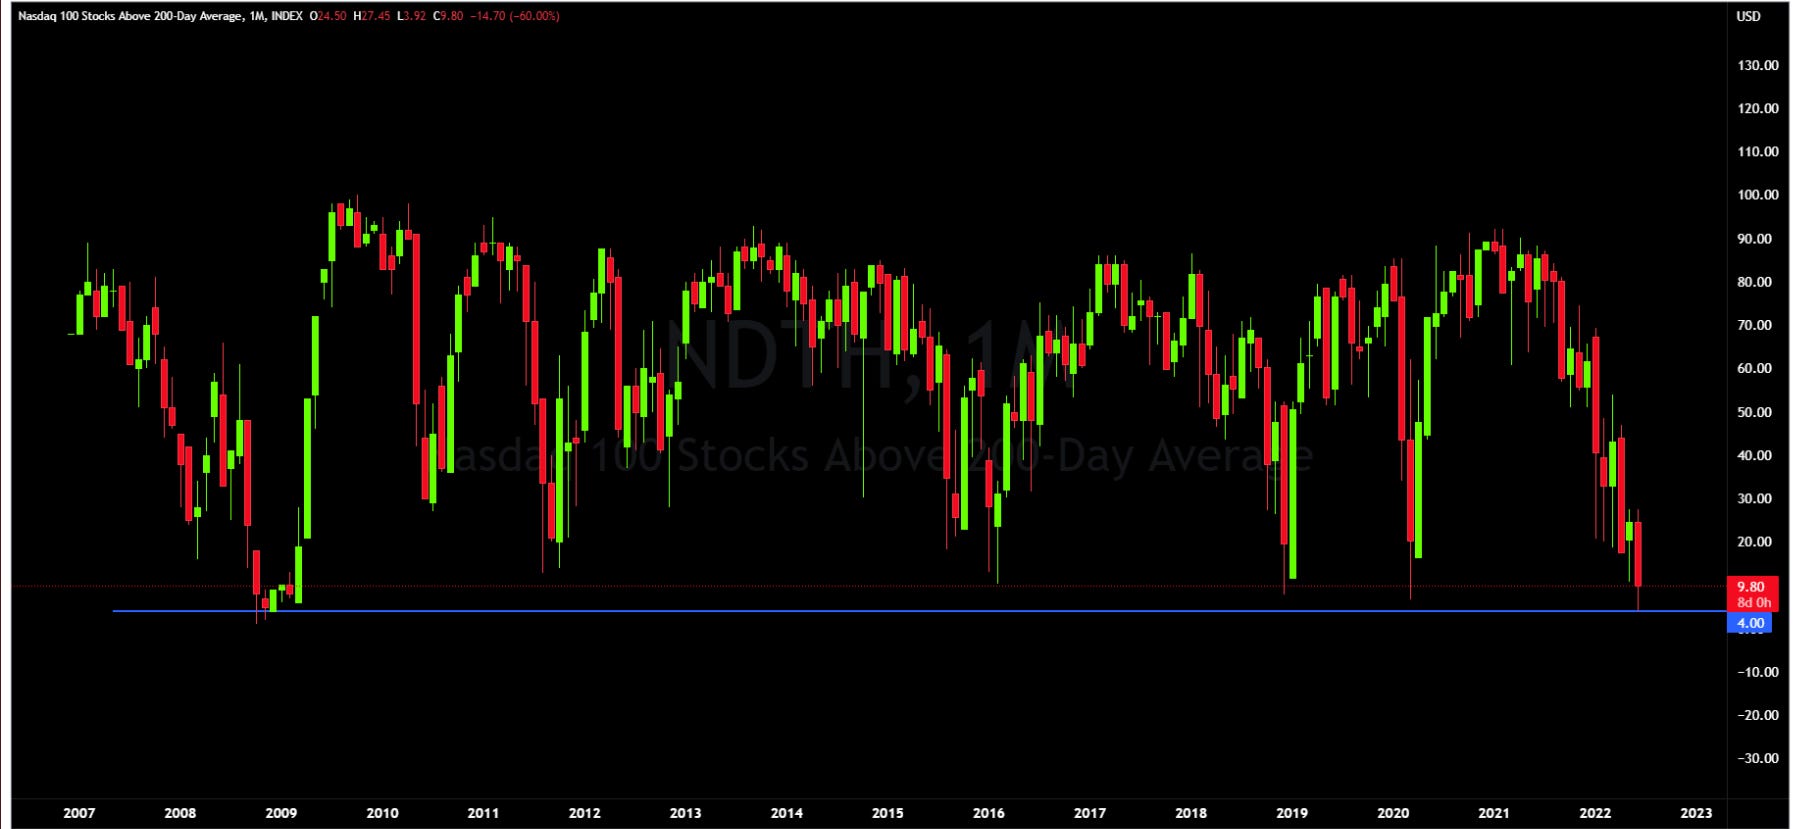
2) Nasdaq 100 Stocks At Historically Extreme Levels
This past week, just 4% of all stocks in the Nasdaq 100 index were holding above the 200 day moving average. The last time this happened in the stock market was the great financial crisis in 2008/2009.
3) Flash Composite PMI’s- Clear Signs of Deterioration/Slowdown
The S&P Global PMI survey, a leading indicator for US GDP output, indicates factory production "fell to a degree only exceeded twice in the 15-year history of the survey, at the height of the initial pandemic lockdowns in 2020...and the global financial crisis in 2008." The massive drop in the US Manufacturing PMI in June was the second-biggest one-month decline of the last 10 years. The Citigroup Economic Surprise also printed a 25 month low this month (and ex the pandemic this is the low tick since 2011).

Stocks I’m Watching
1) Torm PLC (TRMD)
TORM plc, a product tanker company, engages in the transportation of refined oil products and crude oil worldwide. The company transports gasoline, jet fuel, and naphtha and operates a fleet of approximately 85 vessels.
Product tankers have been in high demand due to Russian sanctions as countries, particularly Europe, scramble to secure supplies for oil distillates. Torm initiated a new dividend distribution policy which consists of distributing 25% to 50% of net income on a semi-annual basis, following the half-year and full-year results, and tanker rates are in an uptrend which should increase shareholder returns in the back half of the year. Torm also does not have any significant near term debt maturities until 2026 and contains excellent forward growth estimates (75% revenue growth expected for 2Q22 on 55% EBITDA margins). Torm trades at 7X forward earnings and 32% NTM free cash flow yield. It has significant institutional sponsorship with Oaktree owning >60% of the float. From a technical perspective, Torm has gapped up from its weekly base and has consolidated sideways while the moving averages catch up to resume the uptrend.


2) Black Stone Minerals (BSM)
Black Stone Minerals, L.P., together with its subsidiaries, owns and manages oil and natural gas mineral interests. It owns mineral interests in approximately 16.8 million gross acres, nonparticipating royalty interests in 1.8 million gross acres, and overriding royalty interests in 1.7 million gross acres located in 41 states in the United States.
Black Stone Minerals is largest US pure-play oil and gas royalty and mineral rights owner who has roughly 71% of its production derived from natural gas production vs. oil production. While 75% of BSM’s gas production is hedged for the remainder of the year, 2023 could benefit from higher prices when current hedges roll off. BSM is close to becoming debt free with total debt at $40 million at the end of April and currently yields almost 10 percent. Black Stone Mineral is retesting its base breakout area around $13.50 level. Will this bounce and continue higher?

3) UnitedHealthGroup (UNH)
UnitedHealth Group Incorporated operates as a diversified health care company in the United States. It operates through four segments: UnitedHealthcare, Optum Health, Optum Insight, and Optum Rx.
UnitedHealth is a classic defensive healthcare play that has been riding its uptrending 40WK moving average pretty much since the COVID pandemic market bottom. Institutions have continued to support this stock when dips have occured to this down to this technical level. UnitedHealth is a blue chip healthcare name with a solid dividend yield and strong balance sheet and has had a consistent trend over the past decade of consistently increasing its dividend. In the past 10 years, the company has increased its quarterly dividend from $0.16 per share to $1.65 per share which calculates to a CAGR of about 26%. The current forward dividend yield is 1.33%.

Disclaimer:
All investment strategies and investments involve risk of loss. Nothing contained in this website should be construed as investment advice. Any reference to an investment's past or potential performance is not, and should not be construed as, a recommendation or as a guarantee of any specific outcome or profit.
I love reading your thoughts on the market every weekend. It has quickly become a Sun morning thing for me over fresh coffee. Thanks!