

Weekly Stock Bullfinder - Week of 7/18
Weekly Stock Bullfinder - Week of 7/18
Stocks I'm Watching - Week of 7/18

I hope everyone had a nice weekend!
Earnings Season Kicks Off- What I am Watching
The second quarter earnings season officially kicked off last week with financials getting things started. Earnings season will pick up this upcoming week with key reports expected from notable names like Bank of America, Tesla, Netflix, Johnson & Johnson, and Capital One. We already know that inflation in the form of rising input costs like energy and labor will eat into profit margins and earnings. However, there is a new emerging variable that S&P 500 companies now have to contend with; foreign currency exposure. The one thing I will be watching is how notable S&P 500 heavyweight companies with significant foreign sales exposure are impacted the surge we have seen in the dollar the past quarter as shown in the chart below. Market concerns about higher interest rates and the threat to stocks from an economic growth slowdown, if not an outright recession, have caused a rush back into the US dollar. The U.S. dollar index is up about 16% this year, hitting its highest level since 2002 this past week. The downside for many American companies is that revenues and earnings generated overseas, and then repatriated are now worth less. Another downside is that a stronger dollar makes American exports more expensive, which reduces U.S. economic output and widens the trade deficit. According to Morgan Stanley, the recent rise in the US Dollar could translate into a fall of about 8% in earnings per share for the S&P 500.
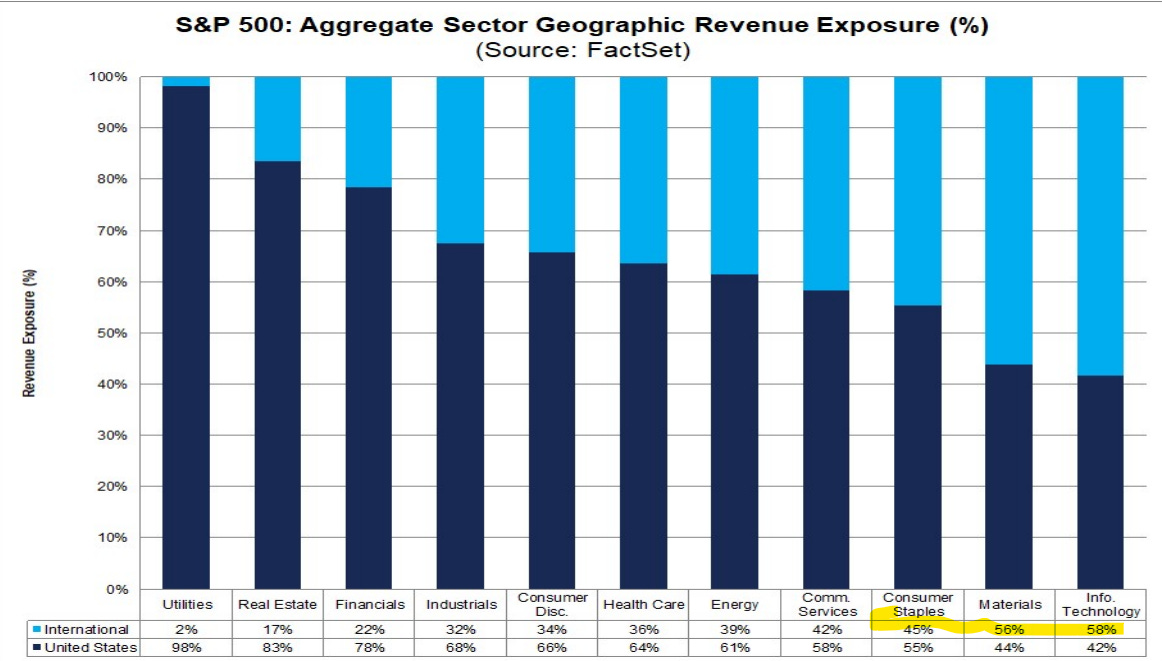
According to Goldman Sachs estimates, companies which comprise the S&P 500 index derive approximately 29% of their sales from outside the U.S, however, certain sectors like technology and materials are particularly exposed. The information technology sector of the S&P 500 has approximately 60% international revenue exposure. For example tech giant Microsoft has already warned that June-quarter sales would be $460 million lower due to foreign currency headwinds, shaving $250 million from its profit. However, many S&P 500 companies have not “early warned” on their upcoming earnings reports through a press release filing like Microsoft has done which could precipitate some nasty negative earnings surprises and analysts subsequently re-rating earnings estimates lower.

S&P 500 companies with the highest exposure to foreign sales include Qualcomm (96%), oilfield services company Schlumberger (85%), disability insurer Aflac (70%), Netflix and Meta (59%), and Alphabet (54%). Given the particular weakness in the Euro, companies with high exposure to Europe will likely have the largest negative adjustments to revenue for foreign currency. These include companies like Bookings Holdings at 79%, Phillip Morris International at 39% and aerospace supplier Hexcel at 44%.
Due to rising inflation, slowdown in high frequency leading economic data, and foreign currency headwinds, among other reasons, Wall Street analysts over the past week have been scurrying to reduce their earnings estimates for this second quarter. In fact, Wall St. analysts have now issued more than 500 downgrades on share-price targets and earnings estimates for S&P 500 stocks over the past week. Such a frenetic pace has only happened 4 other times since the data began in the aftermath of the Great Financial Crisis. Notably, even before 2nd quarter earnings season kicks off, Bank of America now forecasts a mild US recession starting in the second half of 2022 and has lowered their S&P 500 year-end target to 3600 from 4500, a 25% decline (31% is the avg. decline amid recessions).

Elon Musk/Twitter Fiasco
Interesting read on different possible outcomes stemming from the Elon Musk and Twitter buyout lawsuit.
https://www.advisorperspectives.com/articles/2022/07/15/what-if-musk-is-ordered-to-do-twitter-deal-and-he-just-says-no

Some interesting charts from this past week:
1) Rent Inflation Rolling Over?
The "Shelter" component is the single largest component of CPI, making up ~1/3 of the overall index. This past week, the CPI report’s rent component had it's biggest month-over-month increase (+0.8%), and is now up 5.8% YoY. However, year-over-year rent growth is already falling according to Apartment List who expects it will continue to increase the next few months but will then peak in the CPI data later this fall. Apartment List considers its tracking a leading indicator for CPI shelter inflation as its index is based on data for *new leases* only, meaning that it's responsive to the rental market in real time.

2) NY Empire Manufacturing Index
The NY Empire Manufacturing Index points to easing inflation pressures, with Prices Paid and Prices Received falling to the lowest in a year. However, new orders also fell, reaching the lowest level since the Great Financial Crisis. This past week’s data release points to less input cost inflation but also a significant slowdown ahead in manufacturing.

3) Dr. Copper Says Patient is Sick
The term “Doctor Copper” is market lingo for this base metal that is reputed to have a "Ph.D. in economics" because of its ability to predict turning points in the global economy. Because of copper's widespread applications in most sectors of the economy — from homes and factories to electronics and power generation and transmission — demand for copper is often viewed as a reliable leading indicator of economic health. Generally, rising copper prices suggest strong copper demand and, hence, a growing global economy while price declines usually indicate sluggish demand and an imminent economic slowdown. Historically, the year-over-year (YoY) change in copper price correlates well with that of the ISM Manufacturing PMI, which is widely considered a key indicator of the state of the US economy.
The price action in copper over the last three months has been more severe than through the COVID deflation and is quickly approaching Great Financial Crisis levels.

Stocks I’m Watching
1) Capital Power Corporation (CPX.TO, OTC: CPXWF)
Capital Power Corporation develops, acquires, owns, and operates renewable and thermal power generation facilities in Canada and the United States. It generates electricity from various energy sources, including wind, solar, waste heat, natural gas, and coal. The company owns an approximately 6,600 megawatts of power generation capacity at 26 facilities. It also manages its related electricity, natural gas, and emissions portfolios by undertaking trading and marketing activities.
Capital Power Corporation is a energy provider that has seen massive buying pour in the past 4 weeks, clear signs of institutional buying footprints. Capital Power has strong financials with almost a 60% EBITDA margins, 30% EBIT margins, and 11% free cash flow yield while featuring a 5% dividend yield. Capital Power also sports an investment-grade credit rating. Capital Power has numerous solar, wind, and energy storage deployments in its pipeline and has shown a track record of adding profitable projects into its portfolio. From a technical perspective, Capital Power is has emerged from a weekly base in May and is riding its 10WK moving average to higher prices.

2) Elevance Health (ELV)
Elevance Health Inc. operates as a health benefits company. It supports consumers, families, and communities across the entire care journey connecting to the care, support, and resources to lead healthier lives. It serves approximately 118 million people through a portfolio of medical, digital, pharmacy, behavioral, clinical, and care solutions. The company was formerly known as Anthem, Inc. and changed its name to Elevance Health Inc. in June 2022.
After UnitedHealth’s top and bottom line beat this past week, managed care stocks like Elevance saw gains. Elevance is another defensive healthcare name that has consistently seen buyers step in on dips down to its rising 40WK moving average. Last quarter, Elevance reported a top and bottom beat and raise due to premiums which rose 18.46% Y/Y to ~$32.79B; while total operating revenue grew +18.03% Y/Y to ~$37.89B. Elevance trades at a below market multiple at 16X forward P/E. Elevance is scheduled to report earnings premarket on 7/20.

3) Dycom Industries (DY)
Dycom Industries, Inc. provides specialty contracting services in the United States. The company offers program management and engineering services; plans and designs aerial, underground, and buried fiber optic, copper, and coaxial cable systems; and construction, maintenance, and installation services, such as placement and splicing of fiber, copper, and coaxial cables to telecommunications providers. It also provides tower construction, lines and antenna installation, foundation and equipment pad construction, and small cell site placement for wireless carriers, as well as equipment installation and material fabrication, and site testing services; and installs and maintains customer premise equipment, such as digital video recorders, set top boxes, and modems for cable system operators. In addition, the company offers construction and maintenance services for electric and gas utilities, and other customers; and underground facility locating services, such as locating telephone, cable television, power, water, sewer, and gas lines for various utility companies, including telecommunication providers.
Dycom has been bucking the overall market weakness and consolidating sideways but has shown signs recently of turning higher. Dycom is unique in that it has 88% of its revenues derived from telecommunications companies under master service agreements (MSA’s) that feature multi-year, multi-million dollar arrangements with exclusive requirements. This results in Dycom being more insulated from economic gyrations as tailwinds like 5G and fiber deployments provide a steady drumbeat of contracting business. Dycom expects contract revenues for the upcoming quarter to increase mid-teens to 20%. Forward estimates for FY23 include 16.5% revenue growth with a forward P/E multiple of 17X. A solid earnings report and a break above the $100 level could get things moving higher.

Disclaimer:
All investment strategies and investments involve risk of loss. Nothing contained in this website should be construed as investment advice. Any reference to an investment's past or potential performance is not, and should not be construed as, a recommendation or as a guarantee of any specific outcome or profit.