

Weekly Stock Bullfinder - Week of 8/8
Weekly Stock Bullfinder - Week of 8/8
Stocks I'm Watching - Week of 8/8

I hope everyone had a nice weekend!
Weeding Through The Economic Data Cross-Currents
Currently, there is a tug of war between economists and Wall St. banks debating about the Federal Reserve’s next interest rate move and how fast inflation will abate to allow the Federal Reserve to ease off its tightening cycle. The business news media seems almost obsessed with this debate and the latest datapoint to prove one side or another’s argument. The debate continues over the “R” word (recession) and whether the US economy is now in one. Understandably, it has gotten quite political as the midterm elections are now just 3 months away and political advertising will be soon ramping up into the fall. One of the issues I continue to see is that there is so much conflicting economic data out there (some even historically bad) coming out of this hangover from trillions of monetary and fiscal spending, in addition to geopolitical conflicts, that it is very difficult to discern how fast global economic growth is slowing (and at what point we should be concerned!) and whether inflation is just yet in a confirmed downtrend in pockets of the economy that will steadily bring down the Core PCE measures followed by the Federal Reserve. Over the past month, there has been a violent rotation into growth stocks (especially biotech, mega cap technology, software, new IPO’s, and others) as recession fears have crept in and the “inflation trade” (i.e. metals, etc.) has gone into correction. It’s almost as if the bond market is calling the Fed’s bluff that further rate hikes will cause a deeper economic slowdown or that the Fed doesn’t realize its already well on its way to actually being done with needing to hike rates much more.
Employment
The incoming data for US jobless claims continues to trend higher after bottoming in May. However, while the confirmed uptrend suggests some level of labor market softening, we are still well below the pre-pandemic weekly average. In addition, this past week JOLTS job openings fell 600k in July to 10.7M vs est of 11.0M. The 605K decline is largest monthly drop since April 2020 and the third largest drop on record. With the drop in job openings, the ratio of openings to unemployed workers has now declined to 1.8 in June. However, many commentators are now saying the JOLT job openings may be less of a meaningful measure of labor market tightness as job openings are increasingly easy to post in a cyclical upturn, while there is no strong incentive by employers to remove openings even when underlying labor demand weakens.

Wage growth continues to remain strong which may be one of the best explicit indicators of a tight labor market in my opinion. Friday’s July payroll report showed that wage growth surged higher as average hourly earnings jumped 0.5% for the month and 5.2% from the same time a year ago. Also, June’s wage growth figures were also revised upwards 0.1 to +0.4% in June. By all indications, the labor market continues to remain robust and even in the face of labor market softening, employers may be reluctant to do layoffs given all of the challenges companies went through to re-hire workers after the peak pandemic period (think restaurants and other service sectors).
Per Bridgewater research note this week:
“A big near-term decline in wages is unlikely because labor markets are now tight. The unemployment rate is near its lows, job offers are plentiful, and the cost of living is giving people reason to ask for more. Thus, the degree and duration of the tightening must be strong enough and long-lasting enough to bring credit growth down by enough (roughly by half) for long enough—to bring spending down by enough for long enough—to weaken labor markets by enough—to bring wages down by enough—that NGDP growth falls by enough and stays there—to bring inflation down to 2.5%. Historically, the average lead time of a decline in labor markets to a decline in wages is about two years, with a wide range around that average.
….we doubt the scenario that is now discounted in the markets and think that the odds of a protracted stagflation are much higher. Our systems suggest the same for the near term which now doubt the degree of near-term tightening that is discounted, the 2.5% terminal inflation rate that is now priced in, and the future level of earnings that is now priced in, reflecting instead the growing vulnerability of the dollar should those doubts prove true.”
Durable Goods Inflation
The bullwhip effect is now picking up considerable speed hitting the durable goods side of the economy, especially retailers, as durable goods demands has softened as a result of consumers switching their consumption to services and experiences. This past week, the ISM prices index dropped to 60 from 78.5 which was the 3rd largest monthly drop in the last 50 years. ISM inventories are now at the highest level in the last 38 years likely causing pricing pressures to quickly abate and significant inventory “clearing event” likely ahead. The goods news is the the ISM prices paid metric generally leads CPI around 4 months which should translate to lowering the headline inflation number. In addition, freight shipping rates, which went on a parabolic run the past 2 years, continue to abate, albeit are still at historically high levels. The trend remains down which again is a good news story for inflation to come down.


Taiwan- Start of Another Major Supply Chain Disruption?
House Speaker Nancy Pelosi’s visit to Taiwan last week was filled with suspense and drama and clearly angered China who has responded with a de-facto blockade of the Taiwan Strait this week with 4 consecutive days of live fire military drills all designed to simulate an attack on Taiwan. What is not known at this point is what China’s next steps are to retaliate and how long this will persist. Already, global economies are facing challenges with Russia/Ukraine war sanctions and supply challenges and China and Taiwan could be next if this keeps up. After all, the Taiwan Strait is the primary route for ships passing from China, Japan, South Korea and Taiwan to points west, carrying goods from Asian factory hubs to markets in Europe, the US and all points in between. The Taiwan Straight has serviced 88% of the largest container ships in 2022. A prolonged disruption of this important passageway could have significant implications for things like electronics and semiconductors as Taiwan is a the world’s hub for this production. It could also have significant implications for companies who have significant China supply chain exposures.
Per Bloomberg, “While ships can divert around the eastern coast of Taiwan through the Philippine Sea, which would add only a few extra days to the journey, alternative routes pose difficulties. The Luzon Strait between the Philippines and Taiwan offers a possible north-south path, but the typhoon season in the South China Sea makes its very risky for ships to travel. More tropical cyclones enter the area surrounding the Philippines than anywhere else in the world.”

Some interesting charts from this past week:
1) Wage Increases- Time for a Job Switch?
According to Pew Research, a recent employee wage study shows that from April 2021 to March 2022, half of workers who changed jobs experienced real wage increase of 9.7% or more from year earlier; meanwhile, median worker who remained in same job saw loss of 1.7%. I have to say, this was probably one of most eye opening charts I’ve seen in several months!

2) Nasdaq 100- Running into Bearish Downtrend Resistance
The Nasdaq 100 index has now rallied higher over the last 2 months while crude oil prices have fallen off. Can the trend continue with the Nasdaq 100 index testing the upper end of a bearish downtrend trend since January?

3) Mind the Energy Gap
Currently, European natural gas and electricity prices are 5x-7x higher than US levels. To put the German energy crisis into better perspective, 50% of home heating is gas driven, 10% oil. The cost of electricity converted to bbls is close to $600/bbl.


Stocks I’m Watching
1) BJ’s Wholesale Club (BJ)
BJ’s Wholesale Club Holdings, Inc., together with its subsidiaries, operates warehouse clubs on the east coast of the United States. It provides perishable, general merchandise, gasoline, and other ancillary services. The company sells its products through the websites BJs.com, BerkleyJensen.com, Wellsleyfarms.com, and Delivery.bjs.com as well as the mobile app. As of June 10, 2022, it operated 229 warehouse clubs and 160 gas locations in 17 states.
BJ’s is scheduled to report earnings on 8/18 and has seen 12 upward earnings revisions compared to 1 downward earnings revision over the last 90 days. After Walmart cut guidance a few weeks back, Morgan Stanley came out with a research note sounding more optimistic about the buying opportunities presented by Walmart’s peers such as dollar stores and wholesale clubs like BJ’s. At a P/E ratio of 19X forward earnings, BJ’s is priced a bit more attractive than peer Costco. From a technical perspective, BJ’s is putting in a right handle as the moving averages catch up. A solid earnings report could send BJ’s moving higher through its weekly breakout resistance level.

2) Clean Harbors (CLH)
Clean Harbors, Inc. provides environmental and industrial services in North America. The company operates through two segments, Environmental Services and Safety-Kleen Sustainability Solutions. The Environmental Services segment collects, transports, treats, and disposes hazardous and non-hazardous waste, such as resource recovery, physical treatment, fuel blending, incineration, landfill disposal, wastewater treatment, lab chemicals disposal, and explosives management services. The Safety-Kleen Sustainability Solutions segment offers specially designed parts washers; automotive and industrial cleaning products, such as antifreeze, windshield washer fluid, degreasers, glass and floor cleaners, hand cleaners, absorbents, mats, and spill kits; pickup and transportation services for hazardous and non-hazardous containerized waste for recycling or disposal.
Clean Harbors posted a very strong earnings report last week and quickly gapped up on above average volume. Clean Harbors reported Q2 Revenues of $1.36 Billion, up 46% on strength across all sectors. Clean Harbors noted that they are seeing many indications that those positive demand trends will continue in the back half of the year. Next quarter, Clean Harbors expects Adjusted EBITDA to increase approximately 50% from the prior-year period while also raising the midpoint of its 2022 Adjusted EBITDA guidance by $175 million. Clean Harbors remains attractively priced at 16X forward P/E. From a technical perspective, Clean Harbors is approaching its weekly breakout level. A few weeks of rest would allow the moving averages to catch up and trigger a breakout through the ~$115 level. In general, the waste services names like WM, RSG, HCCI are all flashing bullish weekly charts as investors may be seeking more defensive growth at a reasonable price.

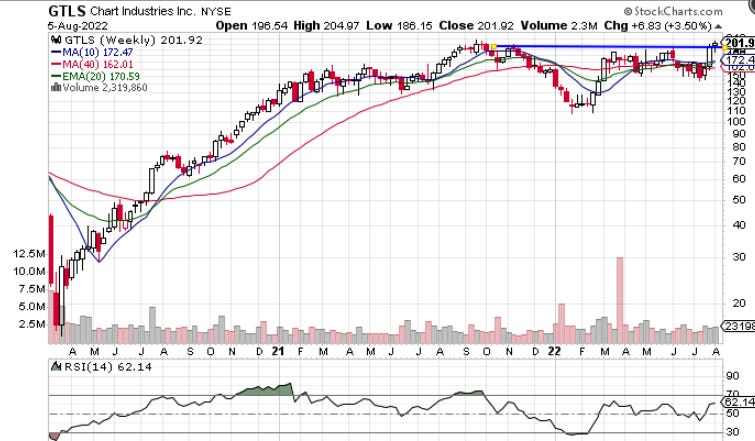
3) Chart Industries (GTLS)
Chart Industries, Inc. manufactures and sells engineered equipment for the energy and industrial gas industries worldwide. The company operates through four segments: Cryo Tank Solutions, Heat Transfer Systems, Specialty Products, and Repair, Service & Leasing. It provides bulk and packaged gas cryogenic solutions for the storage, distribution, vaporization, and application of industrial gases; cryogenic trailers, ISO containers, bulk storage tanks, loading facilities, and regasification equipment for delivering liquefied natural gas (LNG) into virtual pipeline applications; and large vacuum insulated storage tanks as equipment for purchasers of standard liquefaction plants. The company also offers process technology, liquefaction train, and critical equipment for the LNG, including small to mid-scale facilities, floating LNG applications, and large base-load export facilities; brazed aluminum, Core-in-Kettle, heat exchangers, cold boxes, air cooled heat exchangers, pressure vessels, and pipe works; and air cooled heat exchangers and axial cooling fans for the power, heating, ventilation, air conditioning, and refining applications. In addition, it provides highly engineered equipment that is used in specialty end-market applications for hydrogen, LNG, biogas, CO2 Capture, food and beverage, aerospace, lasers, cannabis, and water treatment; and cryogenic components, including vacuum insulated pipes, specialty liquid nitrogen, end-use equipment, and cryogenic flow meters.
Chart Industries continues to consolidate in a tight base pattern while posting yet another recent earnings quarter blowout report. Chart Industries second quarter earnings for 2022 was all-time record breaker featuring record orders ($887.8 million), record backlog ($1,953.3 million), record sales ($404.8 million), record reported gross margin ($94.8 million) and record reported operating income ($29.6 million). Chart Industries is a big player in LNG facility build outs and posted record orders of $887.8 million including approximately $300 million related to Big LNG orders from Cheniere Energy’s (LNG) Corpus Christi Stage Three LNG export terminal. Chart Industries had a weekly breakout last week but may need a few more weeks of rest for it to follow through higher as moving averages catch up.
Disclaimer:
All investment strategies and investments involve risk of loss. Nothing contained in this website should be construed as investment advice. Any reference to an investment's past or potential performance is not, and should not be construed as, a recommendation or as a guarantee of any specific outcome or profit.